Other useful stuff when plotting
There are a few other tools that I wanted to point out before we wrap up our lessons on plotting. These are mostly miscellaneous things that didn’t warrant being packaged with other lessons; generally things that I consider to be “cool”, for lack of a better word at this point.
Including Latex math with figures
Out of the box, pyplot comes with support for Latex math mode, so that stuff that we covered in lesson 5 can really be put to work. There isn’t anything tricky about adding math. The only thing you need to do is add a dollar sign when using strings to turn on mathmode and also put an “r” in front of the string. The “r” tells python to escape special characters (e.g. $,,^) which otherwise might have a special meaning.
[1]:
import numpy as np
from matplotlib import pyplot as pp
from scipy.constants import pi

x = np.linspace(-pi,pi,100)
y1 = (np.exp(x)-np.exp(-x))/2
y2 = (np.exp(x)+np.exp(-x))/2
y3 = y1/y2

fig = pp.figure(figsize=(8,6))

#Make the plot and use latex in the labels
pp.plot(x,y1,label=r"$\sinh(x)=\frac{e^x-e^{-x}}{2}$")
pp.plot(x,y2,label=r"$\cosh(x)=\frac{e^x+e^{-x}}{2}$")
pp.plot(x,y3,label=r"$\tanh(x)=\frac{e^x-e^{-x}}{e^x+e^{-x}}$")
pp.legend(loc="lower right",frameon=False,prop={'size': 18})

pp.xlabel("x")
pp.ylabel("Hyperbolic functions of x")
pp.show()

Subplots
There are alternatives to putting 3 lines on a single plot: subplots. Pyplot makes adding any number of subplots to an existing figure quick and easy using the subplot() function. The basic usage for subplot() is:
subplot(nrows,ncols,index)
where nrows and ncols are the number of rows and columns to use for the figure, and index is the subplot that you want to control next.
[2]:
pp.subplot(3,1,1)
pp.plot(x,y1,color="blue")
pp.xticks(labels=None)
pp.ylabel("Hyperbolic sine")

pp.subplot(3,1,2)
pp.plot(x,y2,color="orange")
pp.xticks(labels=None)
pp.ylabel("Hyperbolic cosine")

pp.subplot(3,1,3)
pp.plot(x,y3,color="green")
pp.ylabel("Hyperbolic tangent")
pp.xlabel('x')

pp.subplots_adjust(bottom=-0.5)

pp.show()
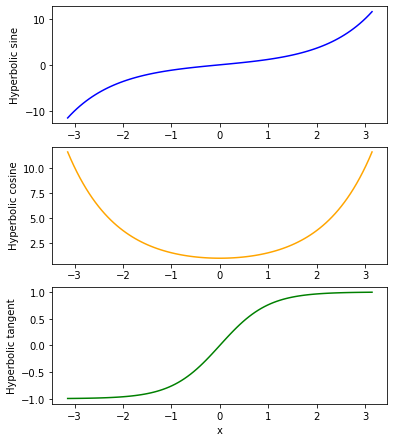
Typically when using subplots() the first 2 numbers don’t change for an individual figure. It is only the index that changes as you move from subplot to subplot. Also, I used the subplots_adjust() function at the end as otherwise the subplots overlapped a little. This is one of the many ways to adjust the spacing of the subplots.
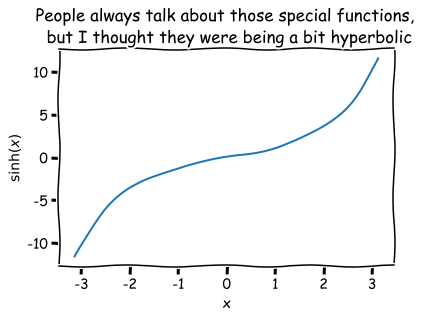
XKCD
Have you ever thought to yourself that you would like to make plots that are styled like XKCD? Well you are in luck! Pyplot can do that for you too!
[3]:
pp.xkcd()

pp.plot(x,y1)
pp.xlabel('x')
pp.ylabel(r'$\sinh(x)$')
pp.title('People always talk about those special functions, \n but I thought they were being a bit hyperbolic')
pp.show()